
No matter how many tests you ve run, once your application is nearly complete, there s really only one way to know whether or not your software can handle the actual demands your army of end users will soon be placing on it. It s called load testing. Load testing is the process of putting simulated demand on software, an application or website in a way that tests or demonstrates it s behavior under various conditions. SmartBear Load Ninja
Let s dig deeper. Here s a legit scenario;
Imagine your team is building a new web application. The front end is a single page app and the back end is a server with a REST API that uses a relational database as the primary data store. Pretty standard stuff. Your team is excited about this new application, and all of the focus is on building the cool new features. Then halfway through your project s timeline, your boss comes in and says:
“We need to do performance testing. I ve talked to the first customer who will be using this application, and they need it to be able to handle 100,000 simultaneous users. Can we handle that?”
If you ask me, the quickest and easiest way to put a load on your app would be with a little help of Apache JMeter.
Let s try.
First things first; you need to have these App/plugins on your machine:
ii) Apache JMeter
iii) JMeter Graphs Generator Listener Plugin **
iv) JMeter Command Line graphs plugin **
v) JMeter Extras plugin**
vi) Latest version of Chrome browser
*reboot the machine after installation
**place the extracted files to their location under the solution folder structure
For the demo purpose, I m going to use a demo store site.
Note: Do not put any web app under the load but your app. Otherwise, you might face legal charges (I am not even joking).
Open the web app within Chrome browser and click on F12 in order to pull out Developer Tools plugin.
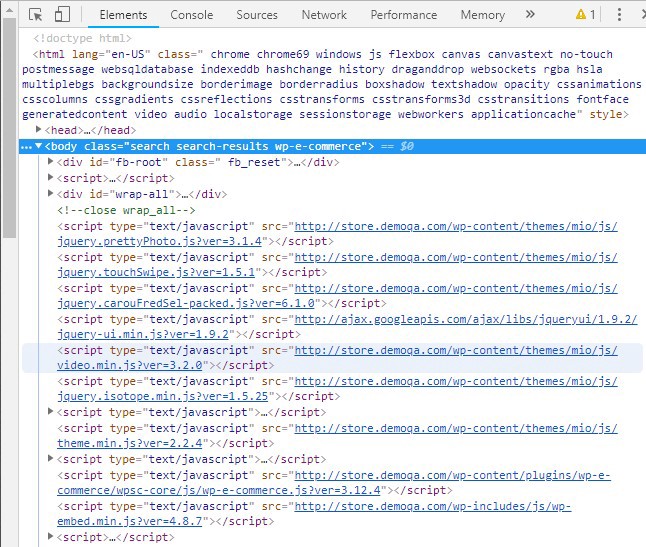
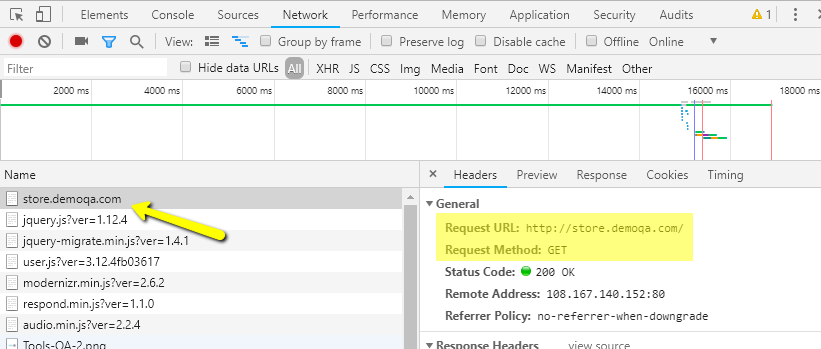
On the top of the Developer Tools plugin click on the Network tab and observe.
Notice there is a web request to the store.demoqa.com triggered after we typed in the URL and pressed enter.
Now, let s trigger the same HTTP request with JMeter tool.
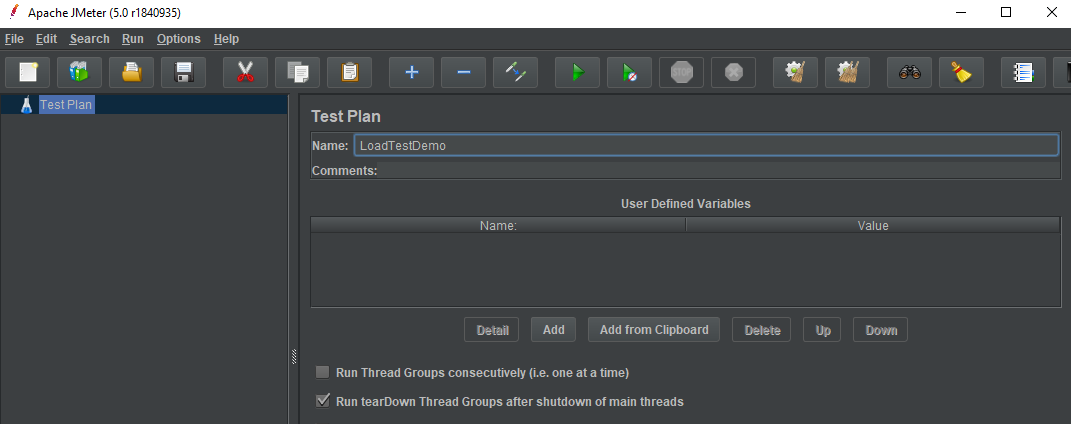
Open the JMeter by double-clicking on the jmeter.bat file located at [installation_location]\apache-jmeter-5.0\bin\
When the JMeter loads up, update the TestPlan name to LoadTestDemo
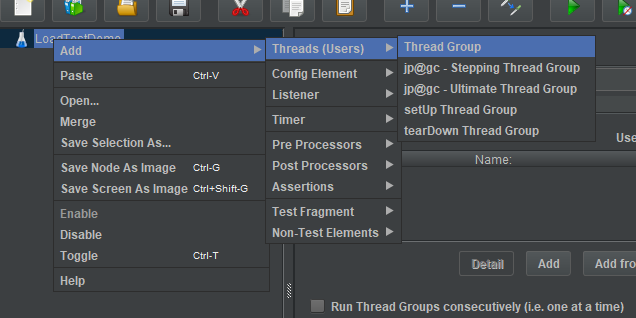
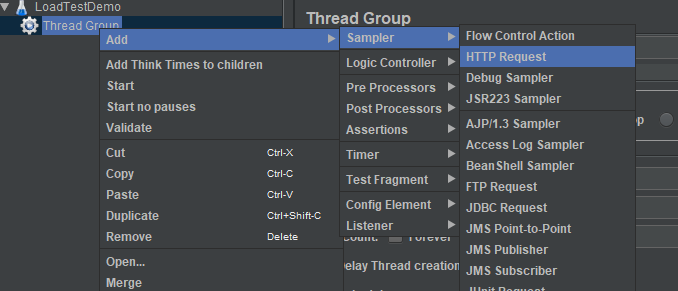
The first thing that we need to add is a thread group. Thread group represents load test properties. Right click on the TestPlan node, in the left-hand pane, and add a new Thread Group. Leave all the default values, for the Thread Group node, as we are going to change it later.
HTTP Request sampler lets you send an HTTP/HTTPS request to a web server. It also lets you control whether or not JMeter parses HTML files for images and other embedded resources and sends HTTP requests to retrieve them. In order to add a HTTP Request sampler, right click on the Thread Group and add a new HTTP Request sampler.
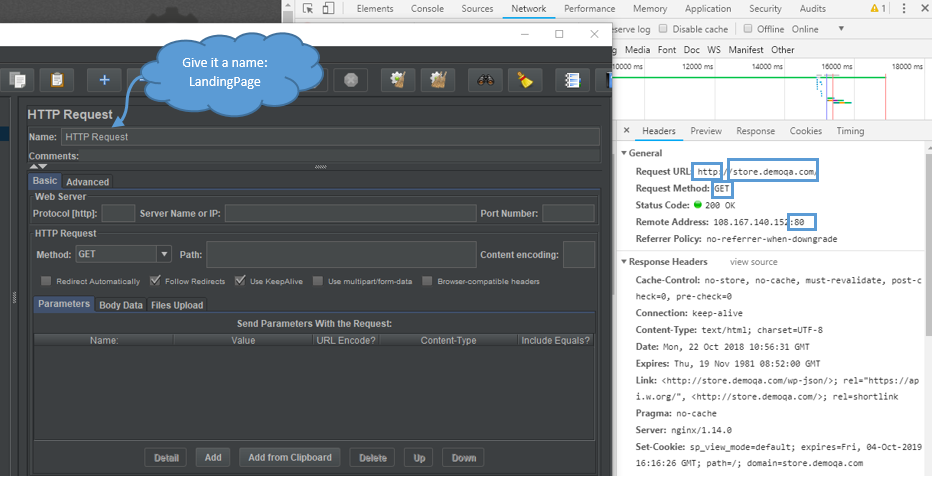
Now, the HTTP Request needs to follow requests sent by browser:
– Protocol [http] = http
– Server Name or IP = store.demoqa.com
– Method = GET
Click on the Run icon from the JMeter menu. Prior to test run, the “Save your test plan” text warning will pop up. Click on the “Yes” button and save it somewhere under the apache-jmeter folder (I saved it at: [installation_location]\apache-jmeter-5.0\Projects\Store\StoreDemo.jmx)
After the test run, you will notice that there are no test results.
The View Results Tree shows a tree of all sample responses, allowing you to view the response for any sample. In addition to showing the response, you can see the time it took to get this response and some response codes. Note that the Request panel only shows the headers added by JMeter. It does not show any headers (such as Host) that may be added by the HTTP protocol implementation.
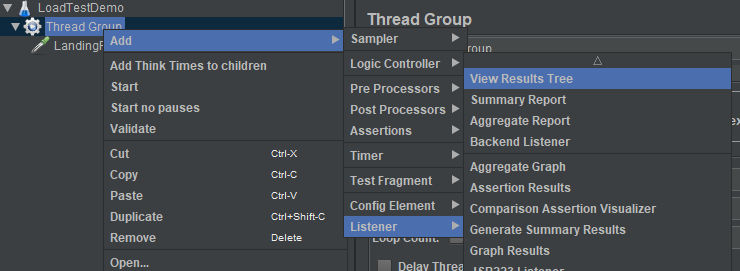
Run the test again and validate results by clicking on the View Results Tree node. It should all be green.
Add more HTTP Requests
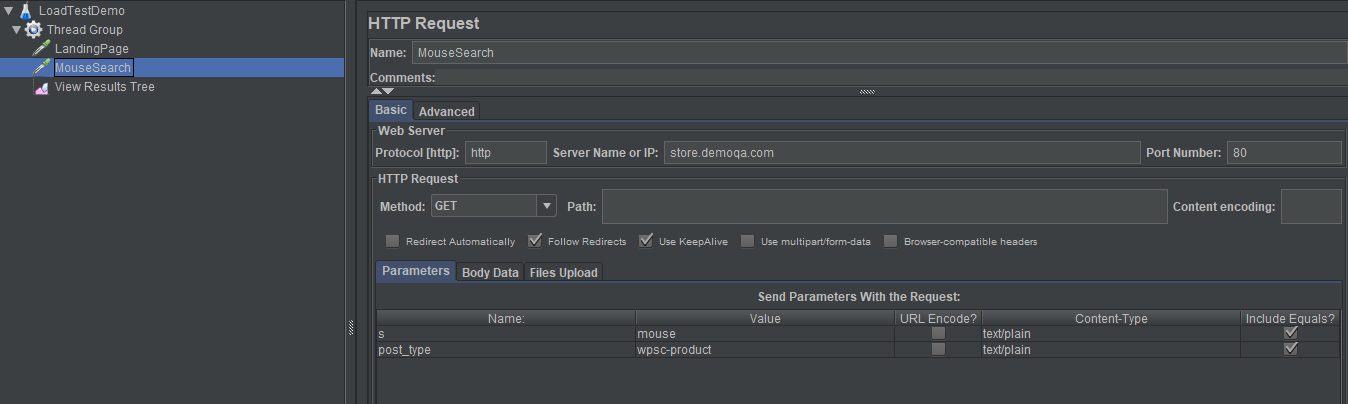
Now, let s type in the word “Mouse” in the search bar and click enter. The new request should look like this:
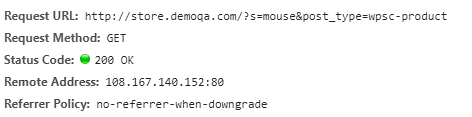
We will notice that the Request URL has changed. Question mark tells us that we are dealing with parameters. Parameter “s“ has value of “mouse“ and “post_type“ has value of “wpsc-product“ (?s=mouse&post_type=wpsc-product).
Create a new HTTP Request node and add parameters.
Note: View Results Tree listener needs to be the last node. If the new HTTP request sample is located after the listener drag and drop it above.
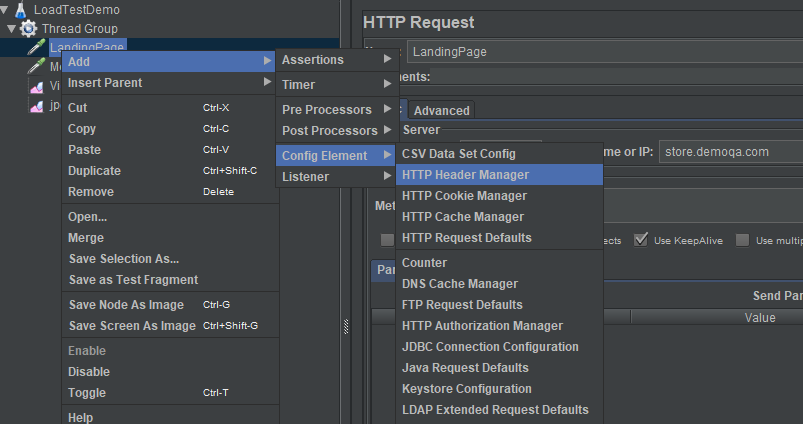
Add a header to an HTTP request
In order to add a header values to a HTTP Request, we need to add a new HTTP Header Manager node under the request s node. In my case that would be “Accept-Encoding” header for the Landing Page.
Pull out header name and value and add it by clicking on the “Add” button.
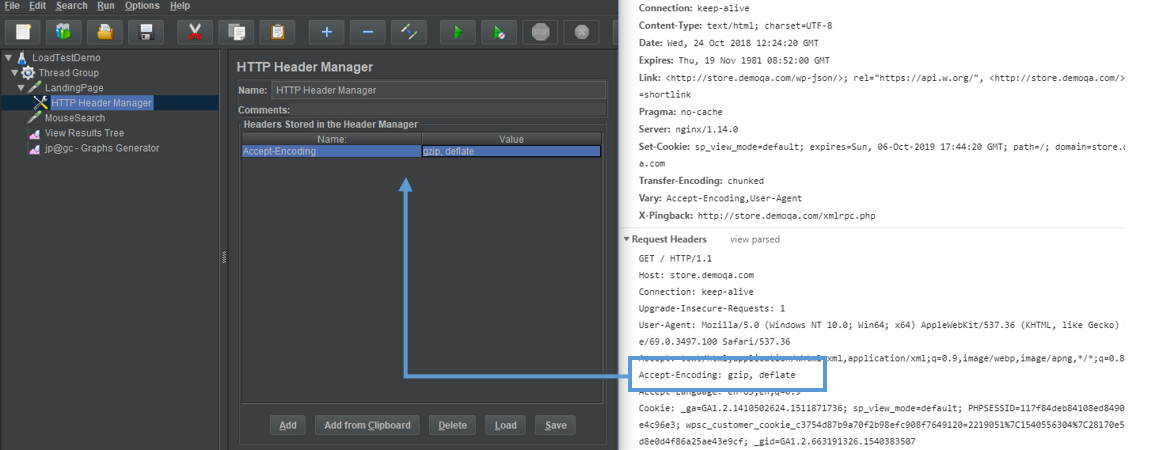
If multiple headers are needed, just add them under the same HTTP Header Manager.
Put heavy weight load and create graphs
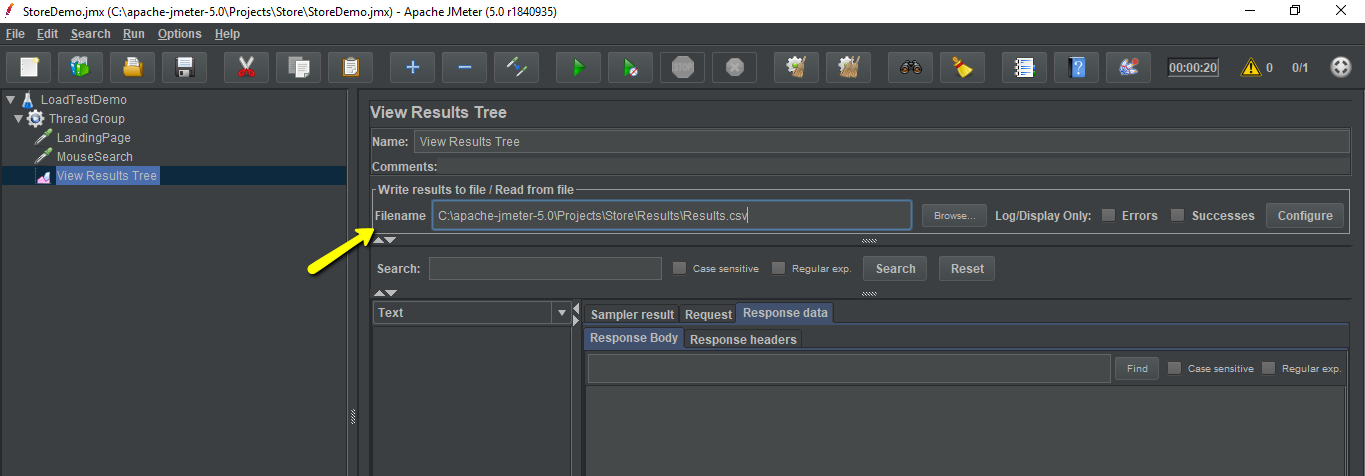
In order to generate detailed test output graphs, open the View Results Tree node and store test results to a (CSV) file. Place the results file, in the Results sub-folder, at the location where your project is saved.
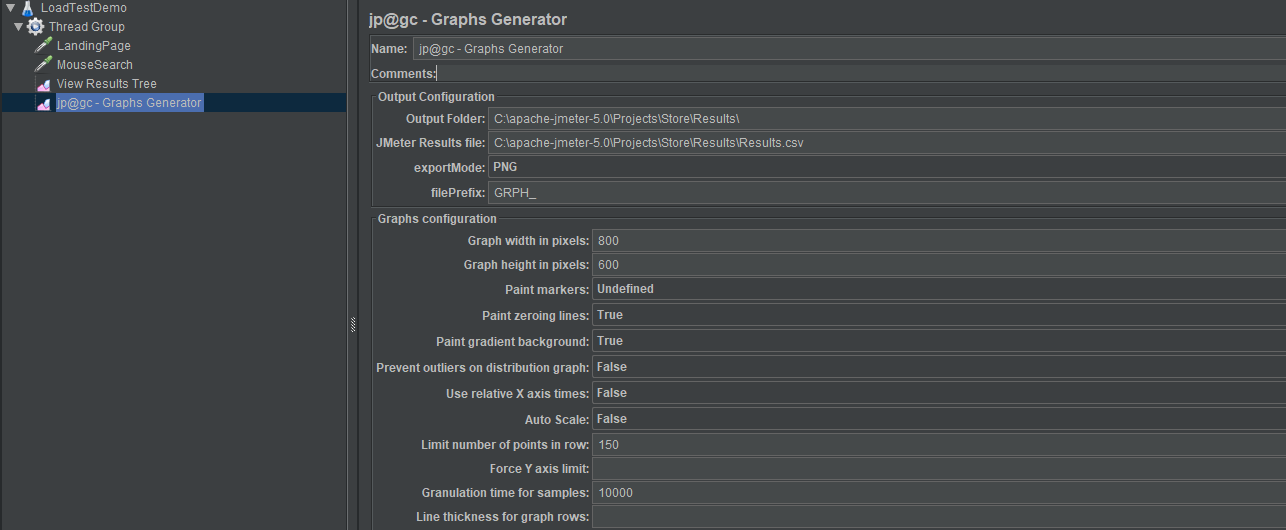
Add a new jp@gc Graphs Generator listener and for JMeter Results file, provide location of the View Results Tree file created in the previous step. Set the output folder to be in the same folder as results CSV and set the Granulation Time for samples to a desired value (in milliseconds).

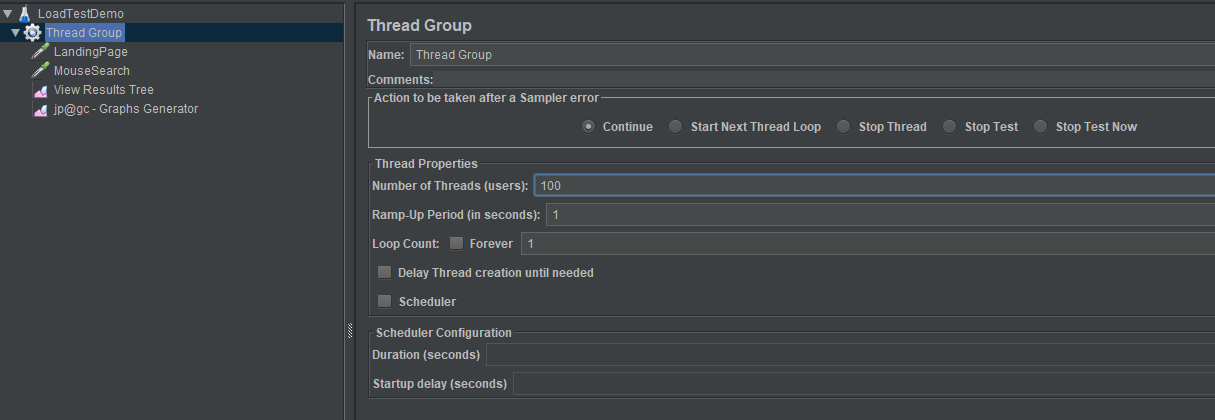
Click on the Thread Group node and increase the load. For example, run it for 100 users (called threads). In the next field, the Ramp-Up Period, leave the default value of 1 second. This property tells JMeter how long to delay between starting each user.
For example, if you enter a Ramp-Up Period of 5 seconds, JMeter will finish starting all of your users by the end of the 5 seconds. So, if we have 5 users and a 5 second Ramp-Up Period, then the delay between starting users would be 1 second (5 users / 5 seconds = 1 user per second). If you set the value to 0, then JMeter will immediately start all of your users.
Finally, enter a value of 1 in the Loop Count field. This property tells JMeter how many times to repeat your test. If you enter a loop count value of 2, then JMeter will run your test twice. To have JMeter repeatedly run a Test Plan, select the “Forever” checkbox.
Save the project and run it.
We notice that for a higher number of concurrent users our test application couldn t handle the pressure and began throwing the HTTP/1.1 503 Service Temporarily Unavailable response. Now, you can play with it by decreasing number of users (Thread Group settings).
Nevertheless, don t forget to verify generated graphs at the hard drive (see Graphs Generator s Output Folder property)

Using response data in HTTP Requests
Sooner or later we are going to face a situation where certain data from a request s response needs to be passed to a next request, such as ID, authorization token etc.
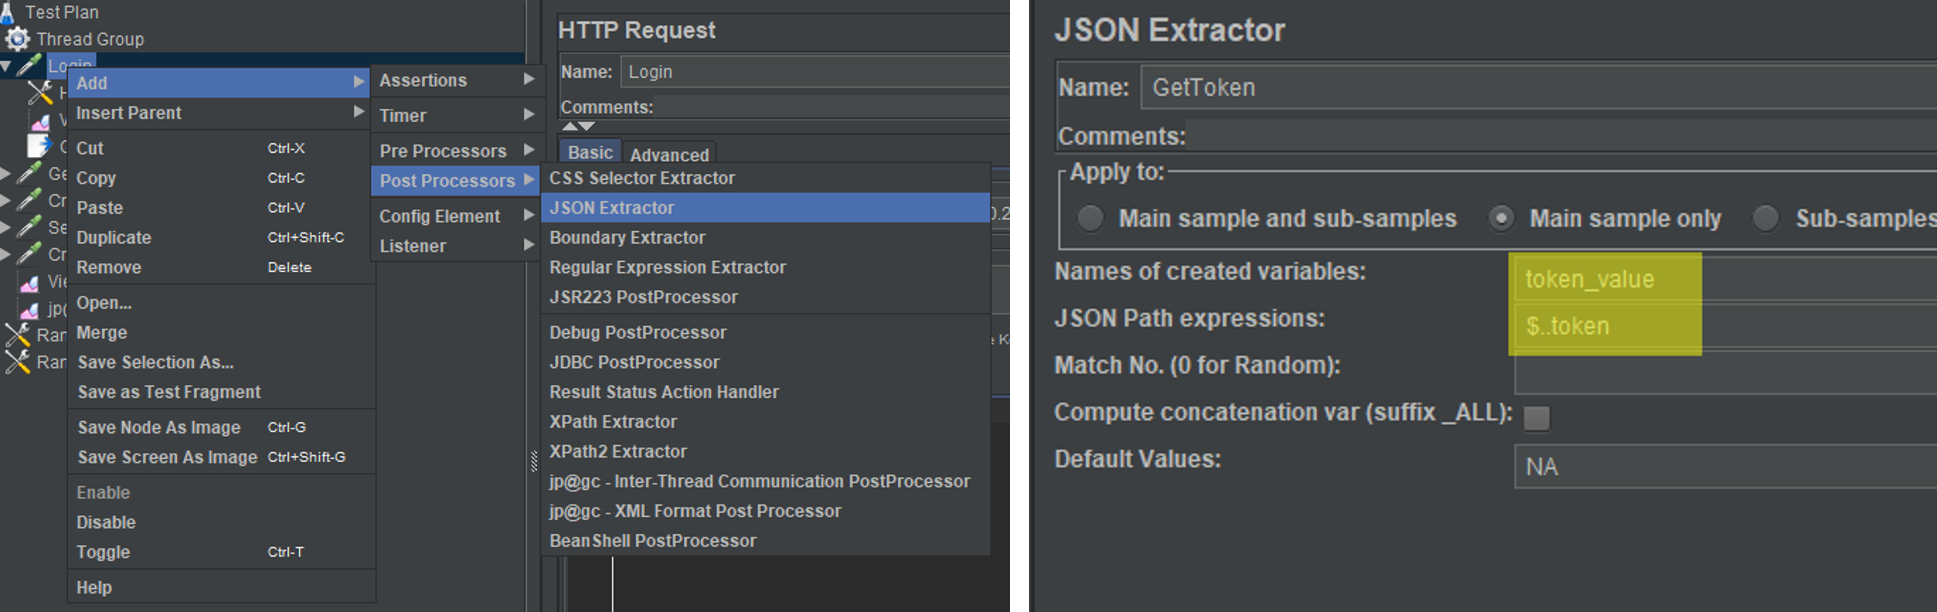
Let s examine the case where after logging in to an app we ll get an authorization token needed for all other requests. In this case, we need to extract the token from the login response and pass it to all requests.
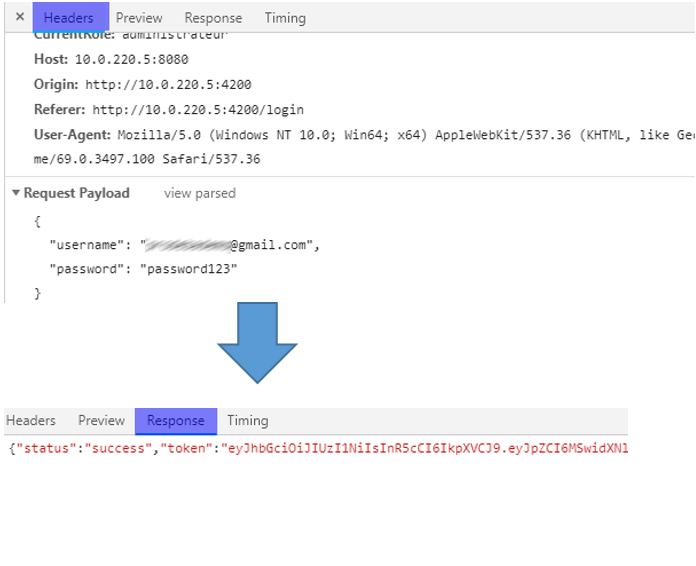
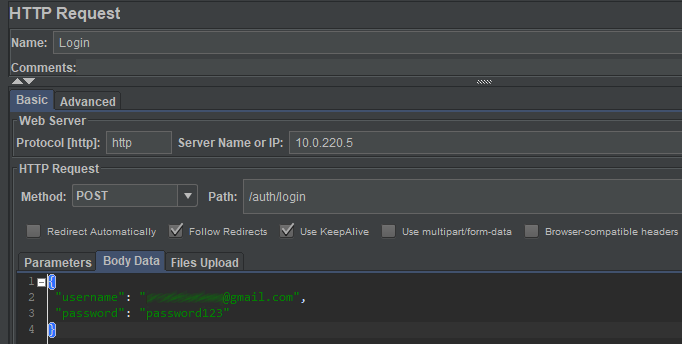
First, create a new HTTP Request with JSON object values passed within the Body Data tab.
Create a new JSON Extractor node and provide variable name and JSON Path expression (token_value, $..token). In order to access the variable value use ${variableName}.
JSON path extractor rules can be found here.

Remember, we, as QAs, are allowed to break things sometimes.
I hope you found this quick guide useful.
Any thoughts? Feel free to comment or ask anything below.
For further reading/watching: